FTEK: About to Head Upward
Sometimes you see a stock that appears to have no clear pattern. Yet candlesticks and gaps can often give big hints on the coming direction of the stock. Here is FTEK, one such stock:
The Technical Analysis for FTEK
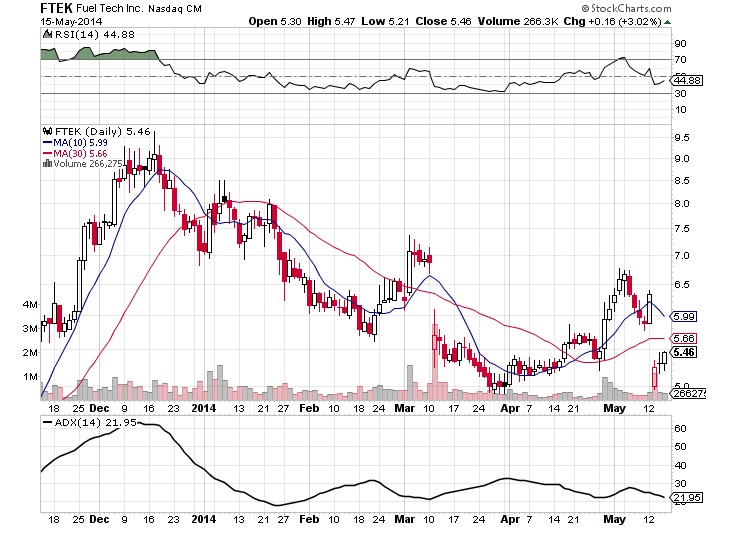
FTEK looks like a mountain range. The peaks and valleys of FTEK are typically caused by spikes in volume. You might notice a pattern in this chart: When volume spikes once, a peak is formed. When it spikes again afterward, a valley is formed. After that, FTEK slowly moves in its current trending direction. Right now, this direction is about to head upward.
If you look at the general trend from a regression point of view, FTEK is neutral. This holds true for nearly every interval; FTEK is neutral in the long-term and in the short-term. But that average is not caused by stability, rather volatility, which makes is suitable for calls and puts.
The recent upward trend has broken. This is obvious from looking at the chart. But the low ADX also points (from a purely numerical view) that the upward path’s momentum has slowed down. A logical conclusion is that the trend has stopped and will become flat or change directions, heading downward.
But where predictions can be made are the candlesticks and gaps in this chart. First, the candlesticks: FTEK has exhibited two significant candlesticks in the last two days. The first is a Doji star. This Doji star on May 14 implies an upward movement. While Doji stars are often hard to draw conclusions from, when they appear at a low point in the overall chart as well as after and above a white candlestick, you can put money that the stock will continue upward. We see this is true by observing the candlestick on May 15, which not only is white and above the Doji star but is also a bullish engulfing stick. Bullish engulfing sticks that appear low in the chart usually imply a coming bullish trend. The Doji star and bulling engulfing sticks together, back-to-back, give much weight to my hypothesis that the stock is about to turn upward.
Next we have the gap. On May 13, a 50 cent gap appeared. A single gap is often followed by a low in the stock price but is later filled. We see this latter part close to becoming true: The gap has nearly been filled by the most recent candlestick. Statistically, the coming days should give us candlesticks completely filling that gap, which means the next short-term trend will be upward.
My Prediction for FTEK
I’m making this trade based on the gaps and candlesticks, not the overall trend (which says little for FTEK as it stands). Based on the candlestick and gap analysis, I predict FTEK will take on a short-term upward trend, at least filling the gap.
My Move | FTEK In-the-Money Call
Because I believe the stock will move upward in response to the recent gap and as a result of the information in the candlesticks, I’ll be buying an in-the-money call at the strike price of 5. Why in-the-money? One main reason: A resist exists around 6. If I bought an out-of-the-money option at 6, for instance, it might not be valuable within its expiration date. I believe the FTEK will go up, but I cannot predict that it will exceed 6. Thus, an in-the-money option gives me the advantage of being able to sell the call for a slight profit when the stock gets close to, but does not surpass 6. The call is more expensive, but the ability to profit from a slight increase is worth the cost.
Still, because no numerical indicators support my hypothesis that the stock will go up, I will not spend too much money on this bet. Let’s just say this is a test as to whether candlestick and gap analysis can prevail over other mixed signals.
Cost of 2 calls at 5: ($140)
Net cost of call strategy: ($140)

No Comment