Introduction
You might have noticed that I have a pretty large set of trading strategies. Running many trading strategies leads to diversification, which reduces overall risk. But as you can imagine, running a large number of trading strategies can be a huge headache.
The truth is, in my daily trading life, I typically stick to a handful of trading strategies that have proved successful over the past few years. I frequently re-backtest these strategies to ensure their efficacy in the present. Every year, I make some changes, moving out the least successful strategies from my toolbox, while testing new potential strategies.
Today, I want to show you my top five trading strategies going into 2022. I suggest adding at least one of these to your trading toolbox in 2022. Almost every type of trader with any amount of capital can apply these strategies.
Here are my top five trading strategies for 2022, in no particular order.
Number 1: Gap Trading
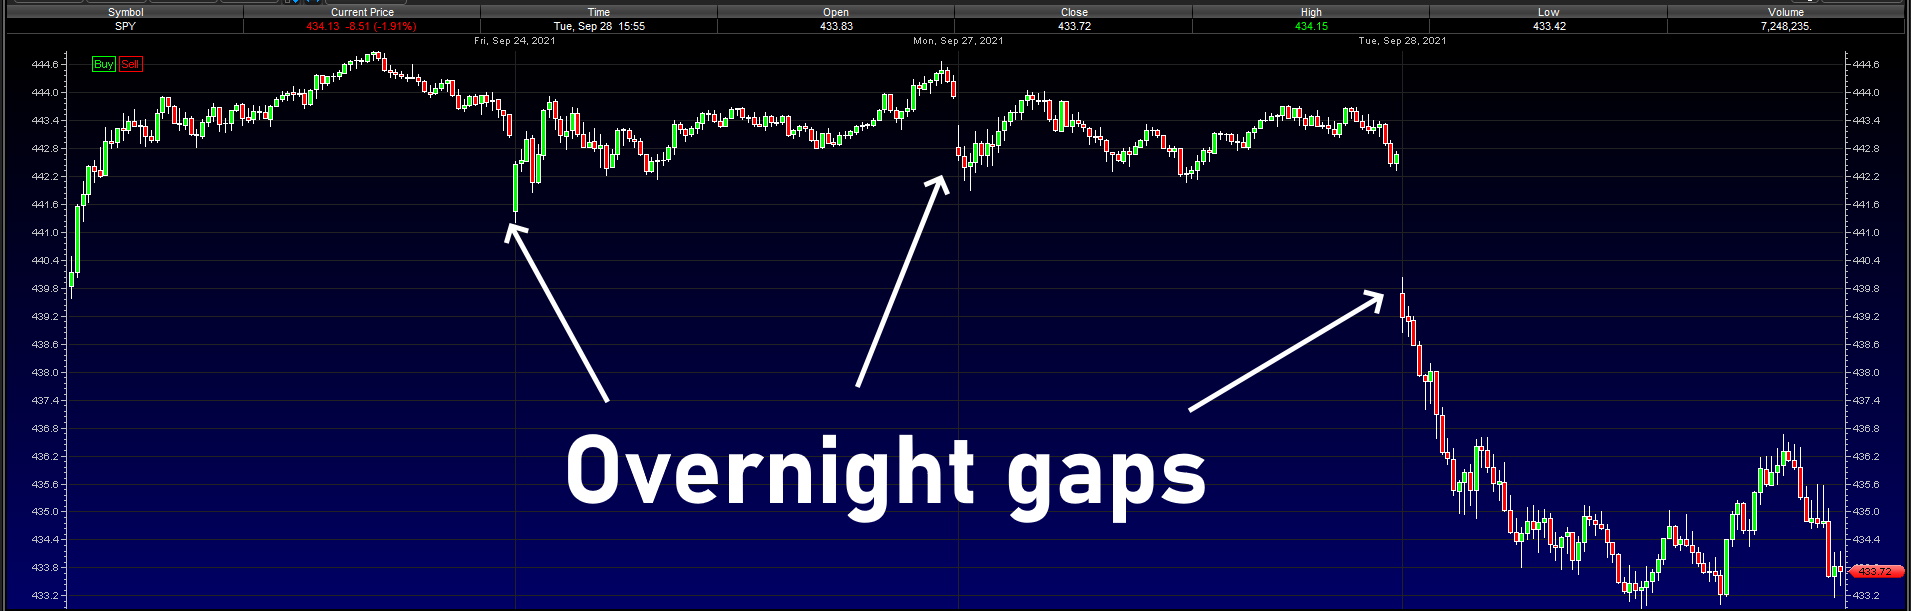
I began my trading career with gap-trading, and the practice remains one of my main go-to trading strategies. Gap-trading is as it sounds: Making a trade after a price gap. You can easily see a gap-trading opportunity by looking at a chart.
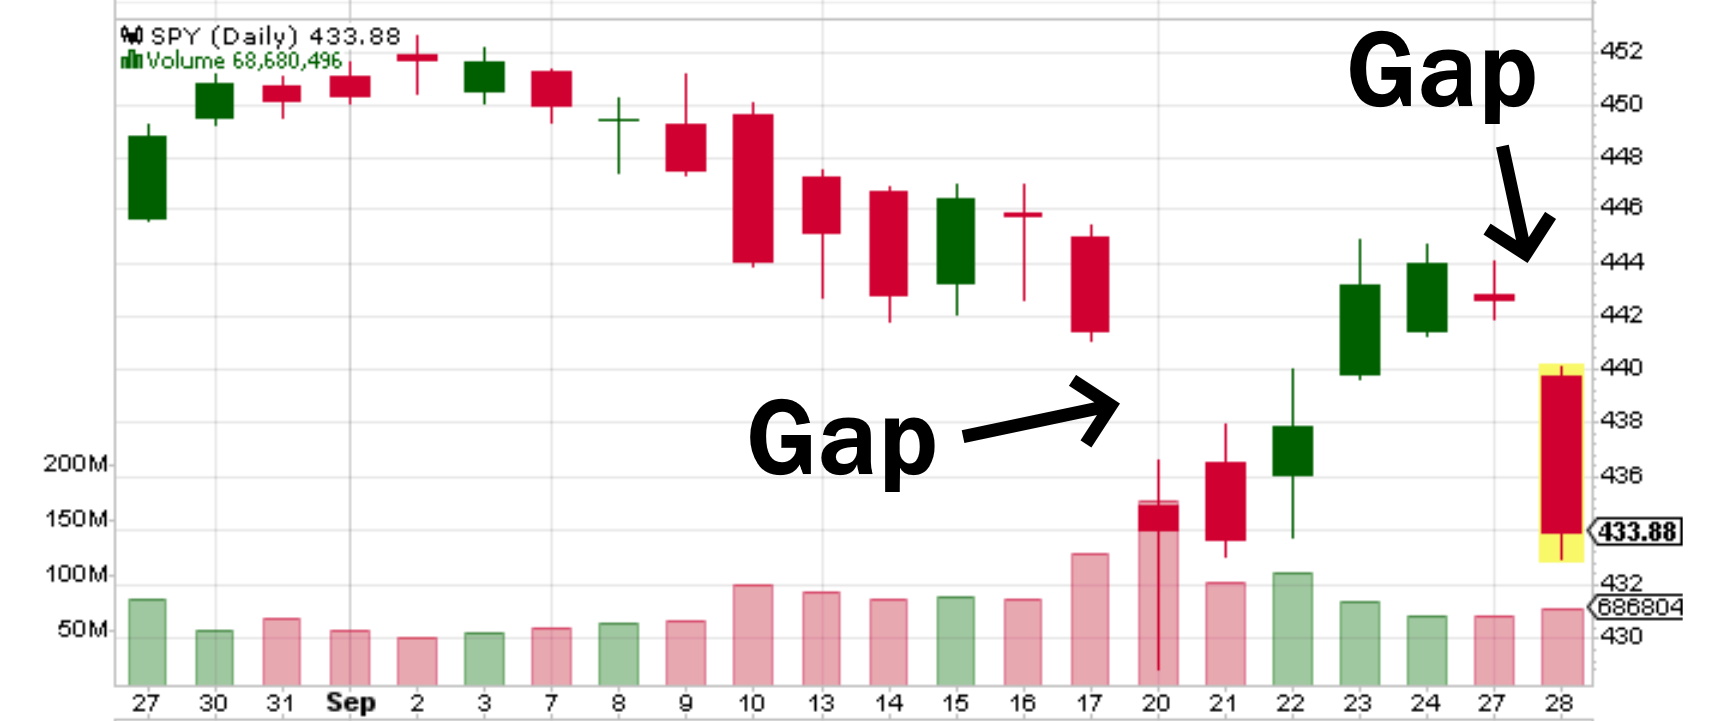
Price gaps occur under various circumstances, but the most well-known instances of gaps tend to be news-based. For example, a company could have just reported earnings that fell outside of the analysts’ expectations, creating a new trading region and a gap in the stock chart. Actually, I often employ gap-trades after earnings trades, which I’ll talk about later.
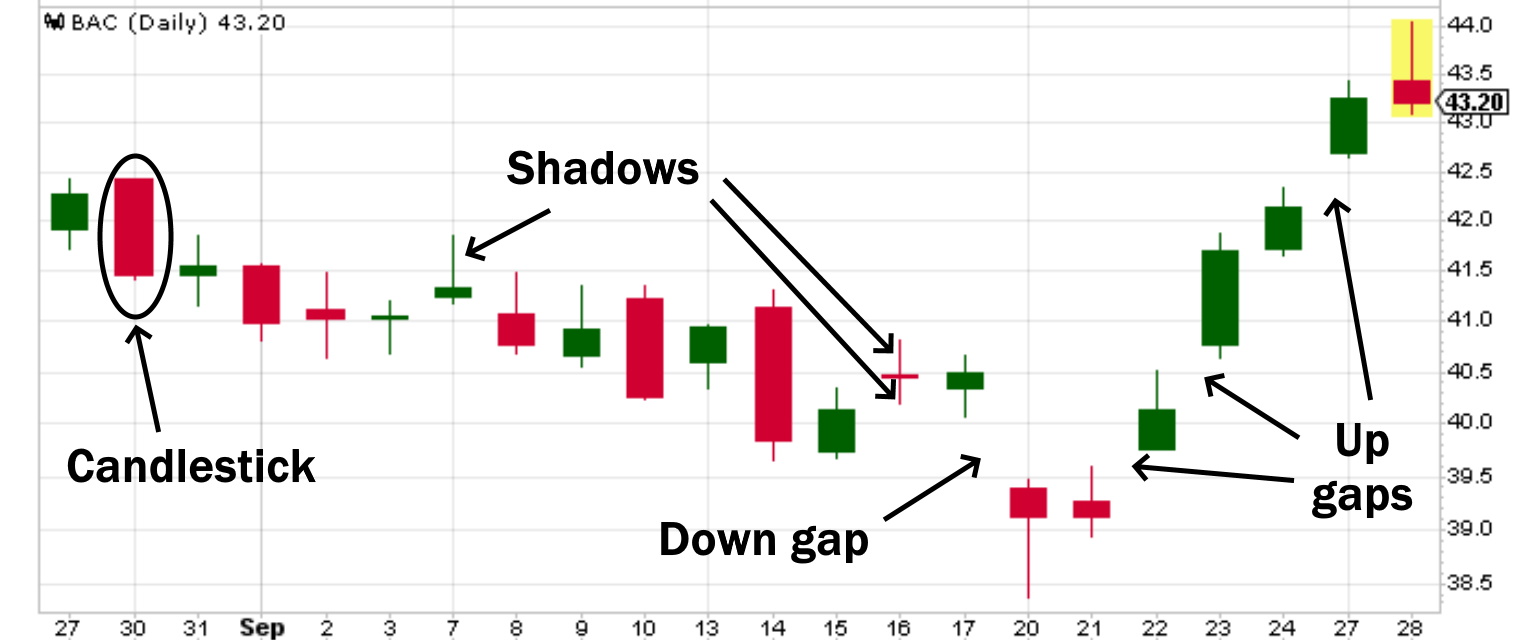
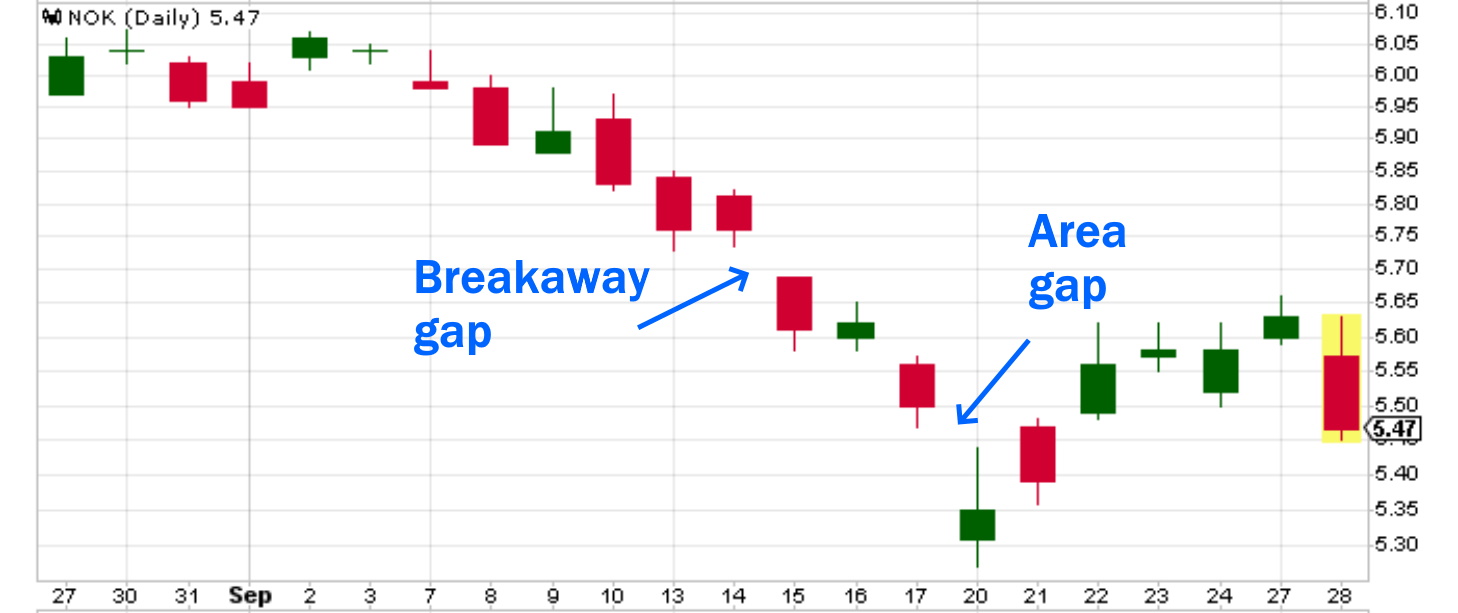
Here are some examples of gaps. When a stock trades higher after a gap, we call it an up gap. When it trades lower after a gap, we call it a down gap. You can see that the stock essentially skipped over some prices, creating the gap. It is only a gap if both the candles and shadows clear the gap. Remember, candlesticks are created from the open and close prices, while shadows are created from the high and low prices.
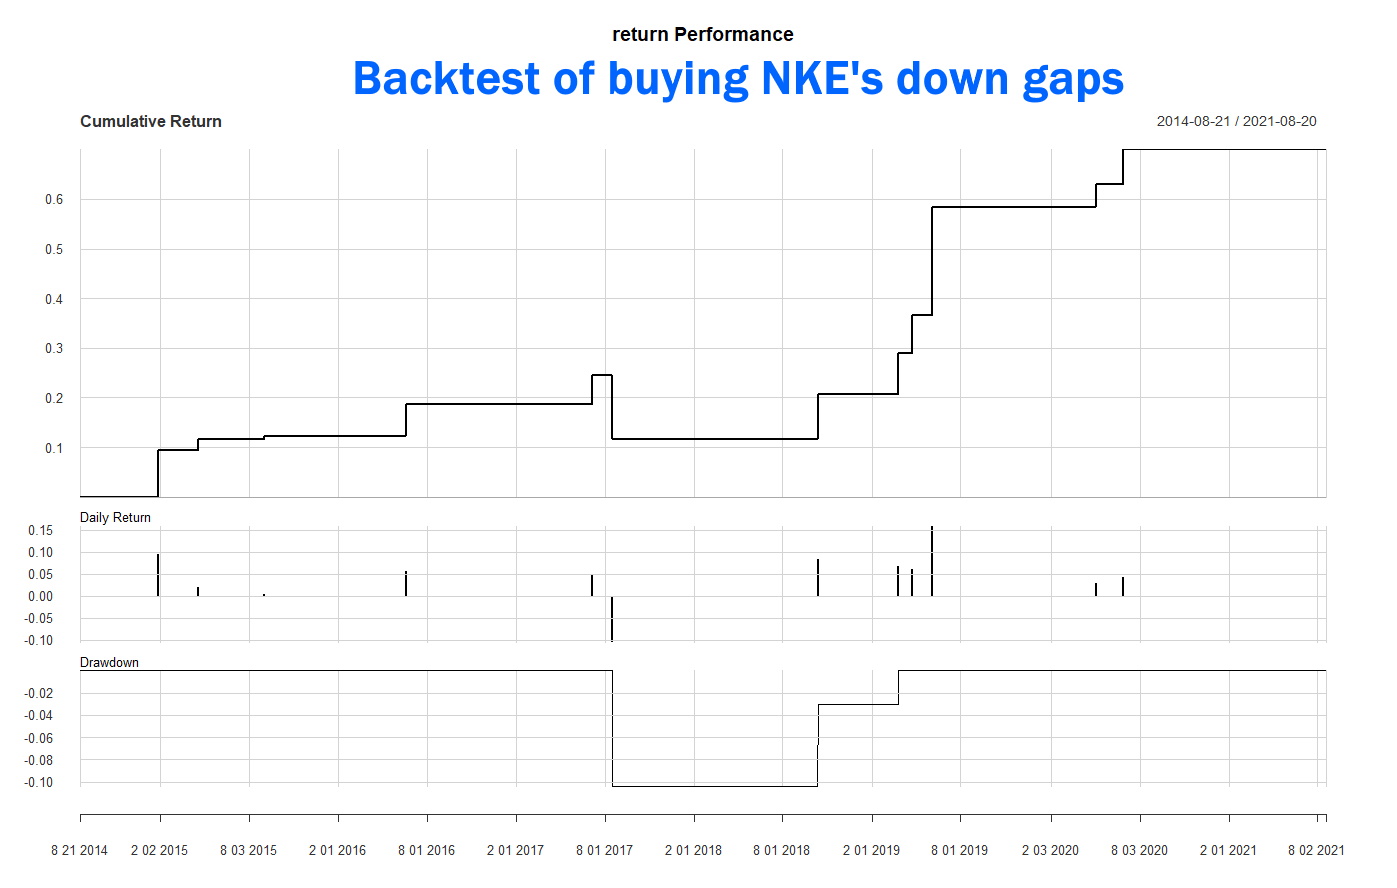
As for actually trading gaps, we can consider gap-trading a sort of technical-based trading system. I’ve backtested thousands of gaps over my trading career and found that most gaps can be traded based on what they look like in the charts. Even better, unlike other technical analysis, predicting the post-gap movement is an entirely objective process, unaltered by the eyes of the trader.
A gap is defined as an empty space between two days’ successive candlesticks and can be mathematically defined by the lows and highs of said candlesticks. This mathematical definition has allowed me to backtest any gap I see, leading to my gap-trading rules. The rules themselves can be found in my gap-trading guides on my website, but we’ll go over some basics here.
First, gaps can be classified into many types, but I’ve found that only two main types matter: Those that fill and those that widen. For simplicity’s sake, I just call them area gaps and breakaway gaps, respectively. You want to bet in the direction of the gap for area gaps and bet against the gap for breakaway gaps.
Area gaps are great because they provide us with an immediate price target. Breakaway gaps are a bit harder in this respect but offer bigger potential gains than area gaps. Think of area gaps as reliable, high-probability short-term trades, while breakaway gaps are their kurtosis-heavy brothers.
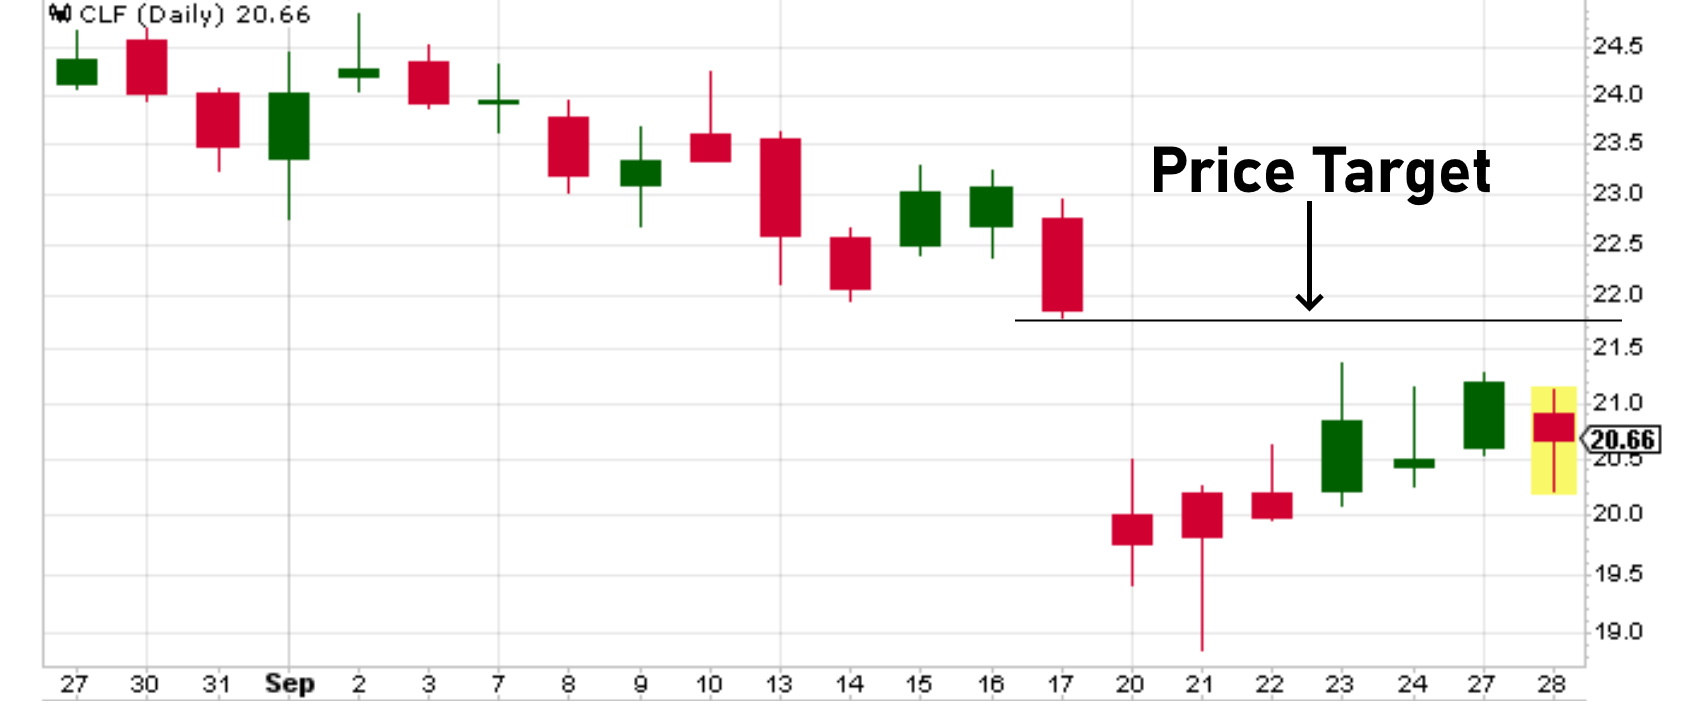
I prefer trading area gaps, using options as leverage. Even a $1 area gap can equate to $100 profit per option over the course of a few days, as area gaps tend to close quickly. Here are some benefits of trading area gaps in 2022.
Gaps are increasingly common these days. You would think, with increased liquidity in the markets these days, that gaps would be rarer, as liquidity reduces large movements in price. However, as per my data, gaps have become much more frequent in the past few years, more than double in number compared with one decade ago. Obviously, this means gap traders have many more potential trades today than ever.
With area gaps, you get high-probability predictions of a stock’s short-term direction. This is a rare find in trading. Even the best technical patterns are not as reliable as gaps in predicting short-term price action.
Area gaps give clear, objective price targets. If you’re trading an area gap, you don’t need to make any decisions with regard to price-based exit strategies. In addition, you know right as you see the gap your potential profit.
Most area gaps close quickly, and so you also can get an easy time-based exit strategy. For example, the average time it takes an up gap to close is five days. If you are like me and don’t particularly like price-based exit strategies, you can – for the instance of an up area gap – buy the next week’s weekly put options and close before the expiration date.
Gap-trading, once you know the rules, can be done quite quickly. I generally only need to look at the size of the gap and the colors of the candlesticks surrounding the gap to determine whether a gap is an area gap. This allows for a quick and easy position entry.
For more on gap trading, check out the Gap Gameplan.
Number 2: Sideways Trades
The market is beginning to show signs of weakness. During times of investor indecision, we often see a “crabby” market. Just as a crab takes a few steps to the right and then to the left, retreading its path, the market often goes nowhere.
The most basic investors are long-only. A smarter group also engages in short positions. But the very best traders can also profit from sideways movements – or consolidation – in the market.
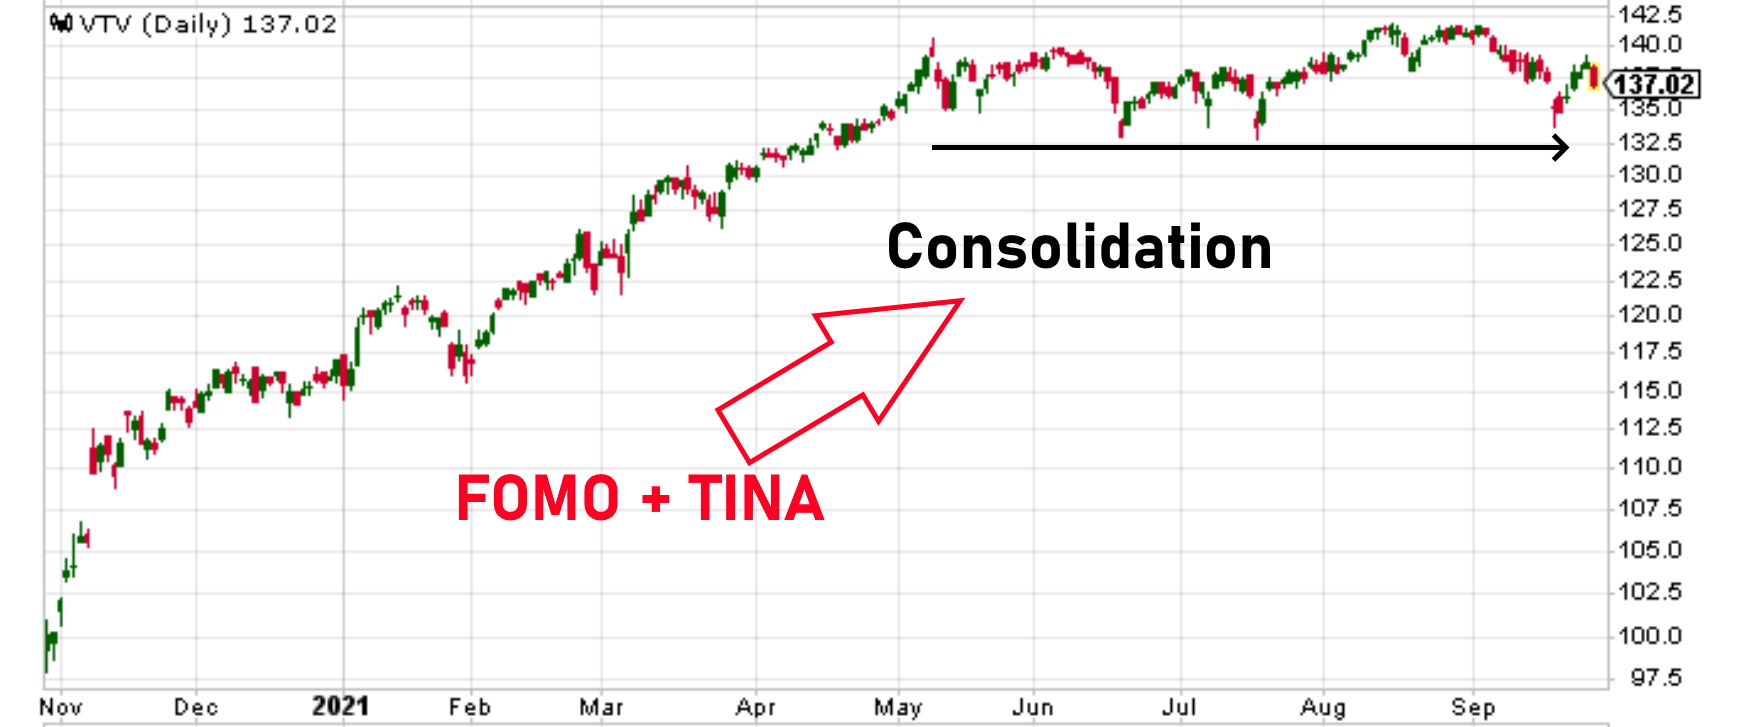
I expect to see a lot of consolidation in 2022. Valuations are stretched, but to counteract this are the ideas of FOMO, or a fear of missing out, and TINA, or there is no alternative. FOMO pushes the market up after a rally, as investors rush to buy stock to not be left out of the next rally. TINA pushes the market up merely due to the idea that there is no superior investing alternative to stocks – you either buy stocks and profit or you are stuck in investments with miniscule return, such as the near zero percent ROI that bonds offer.
So, these two effects put upward pressure on the market, but the overboughtness of the market, as judging by financial metrics such as price-to-earnings and EBITDA-to-EV, will cause investors to hesitate hitting the buy button, lest they buy at the absolute top. While the market loses its momentum, trading sideways, we can still profit via one of the several options strategies designed to profit during consolidation. The easiest method by which to do so is the calendar spread, which requires a mere $2,000 in your account and does not require margin.
In a calendar spread, you profit from the difference in time decay of two options. You hold long one far-term at-the-money option, while selling short a near-term at-the-money option. As long as the stock you are targeting stays within a tight trading range, you will end up with a profit by the expiration of the near-term option.
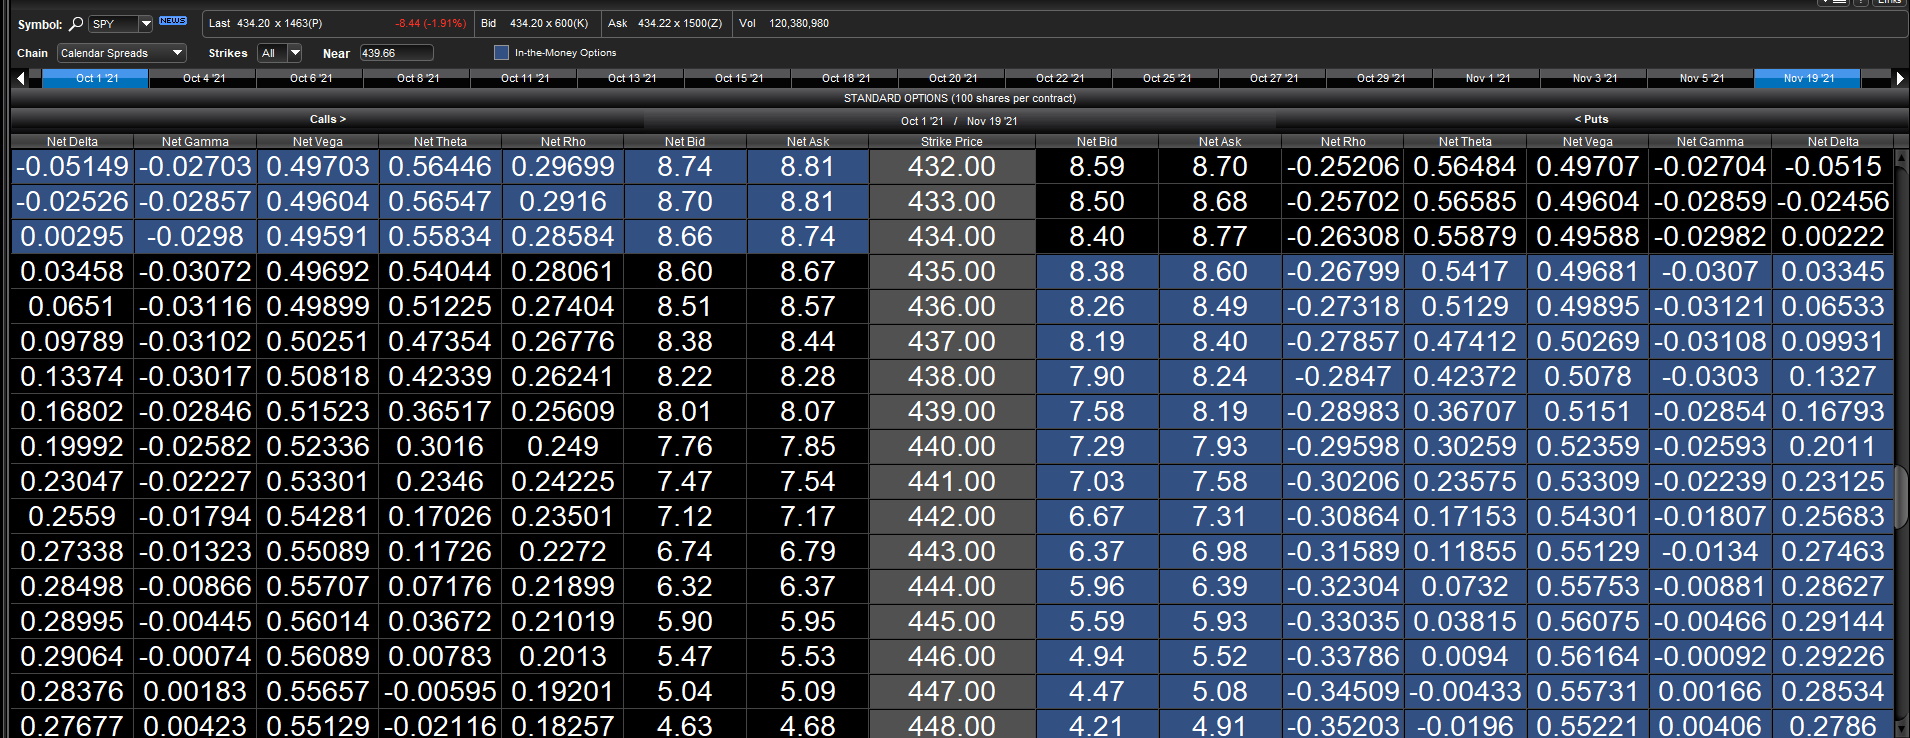
Here is an example of a calendar spread using puts. The SPY at-the-money near-term, October puts are trading at about $150 each, with a theta value of 0.35. We sell these while buying the November puts, which cost about $900 each, having a theta value of around 0.10. The position costs us about $750 to open, but out net theta value is around 0.25, as we subtract the theta value of the long puts from the short puts. That theta value of 0.25 implies that we’ll be profiting to the tune of $25 per day if the SPY trends sideways. Once the October puts expire, we sell back the long put to capture that profit, which should be somewhere between $100 and $200, equating to a 20% ROI over the course of a week or so.
For more on options trading, see my options playlist.
Number 3: Seasonal Trades
I have been using seasonal strategies for as long as I can remember. While many will tell you not to attempt to time the market, some stocks, sectors, and ETFs have reliable seasonal patterns that you can leverage. In a seasonal trade, you are taking a position over a unit of seasonality, such as a month or even a season – for example, holding a position over summer. In such a trade, you are aiming to capture the expected movement over that time period showing seasonal patterns.
In 2022, with valuations so stretched, everyone is looking for an edge. Seasonality is one such opportunity this year. I run backtests to find seasonal patterns in the stocks as well as ETFs I trade, and you can leave a comment below to request I run such a test on your stock of choice.
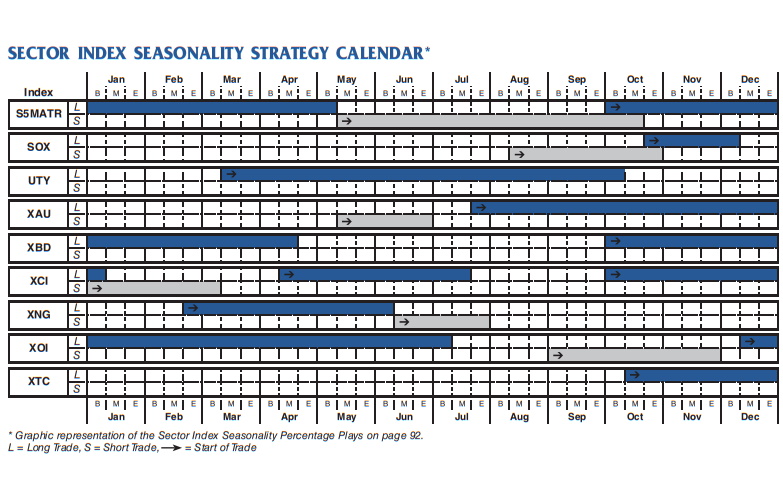
In the meantime, here are a few seasonal patterns you can consider trading:
- The US market tends to show weakness starting in September and into mid-October.
- Uranium prices and ETFs tend to rise in November, into the subsequent year.
- Precious metals, such as gold and silver, tend to rise in the summer.
- Stocks in the housing market tend to peak in the summer, coinciding with good weather and families moving into new homes before the school year.
- A short position on heating oil in January almost always works. You can also swing-trade it, swinging to a long position from February to April for more gains.
- The Santa rally is well-known and describes the proclivity for the US and UK markets to rally into December.
Number 4: Earnings Trades
Nearly one decade ago, shorting Netflix into earnings caused my account to blow up. At the time, I had just moved to Japan and had no social support system in place. I could not afford rent, and had to live homeless in Kyoto for a couple months, sleeping under a bridge.
Because of that event, I committed myself to understanding earnings, with an emphasis on predicting how stocks will react to earnings. Now, I can predict the earnings movement of stocks to a reliable degree, giving me a high risk but high reward trading strategy for my toolbox in 2022. With earnings trades, you can see triple-digit ROI in under 24 hours, provided your prediction is correct and you run the trade with options.
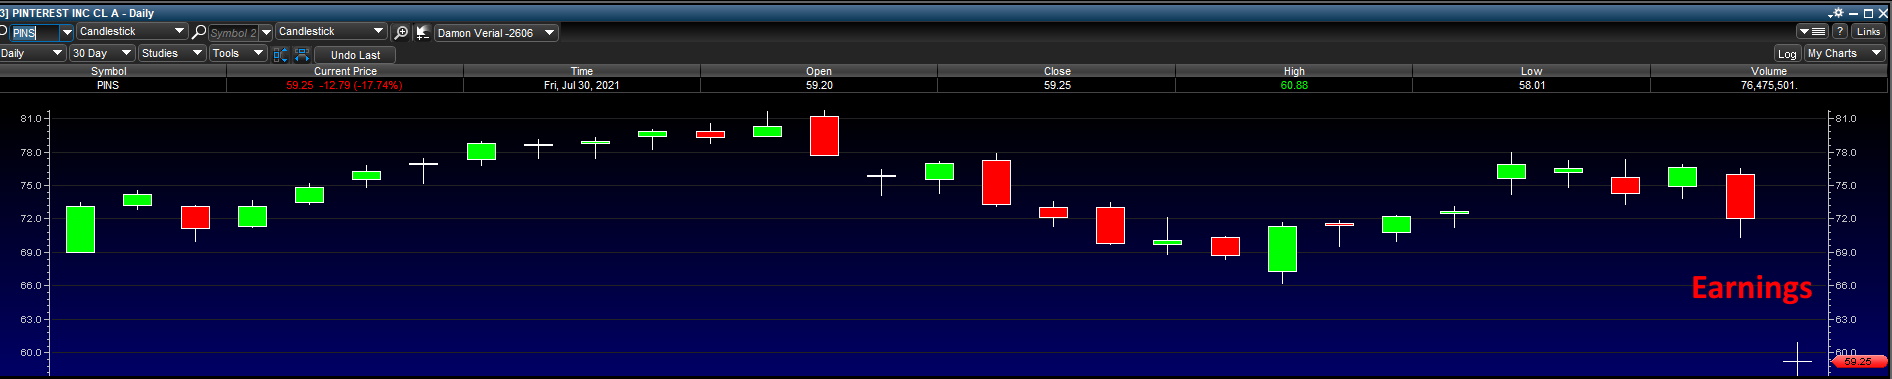
In short, an earnings trade is when you take a position in a stock right before the company reports its quarterly earnings. This means that you’re taking a position at the end of the day, as companies report earnings when the market is closed. You then close the position the following day, at the open, capturing the movement spurred by the earnings report.

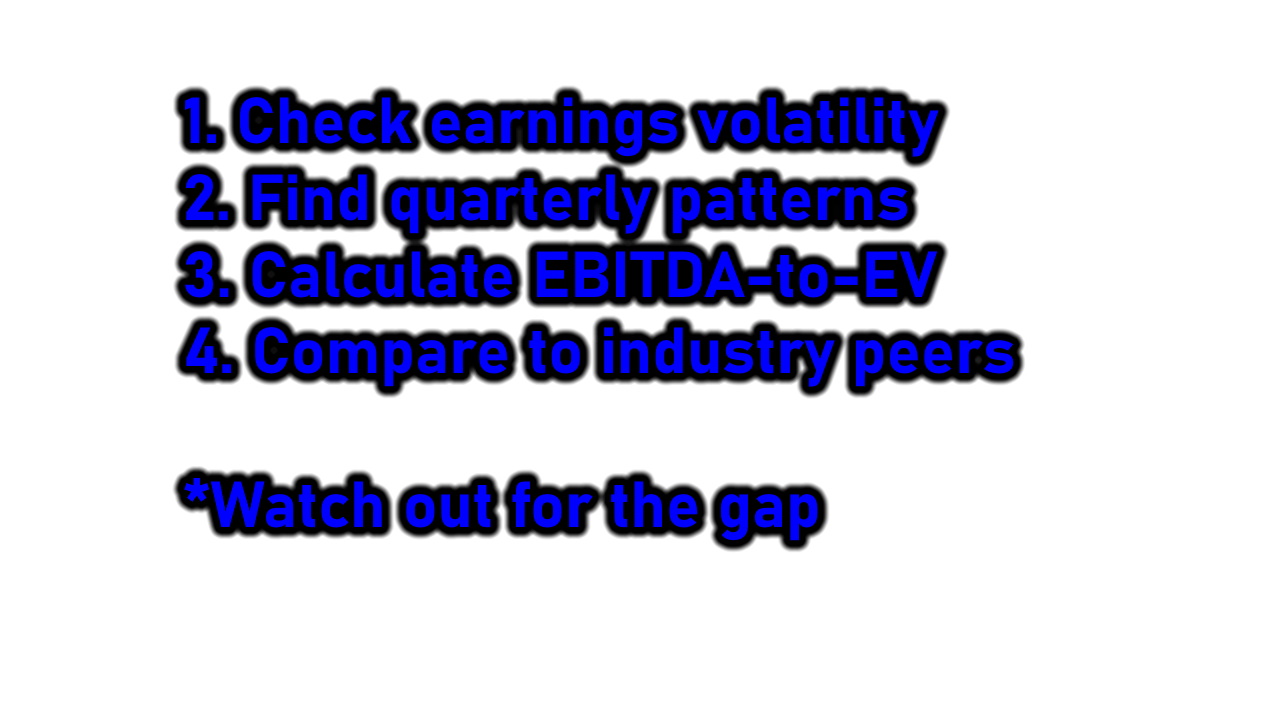
Predicting earnings with consistency is a difficult task. I spent years poring over the financial literature and backtests to get my current method. I’ll give you some of my most useful heuristics.
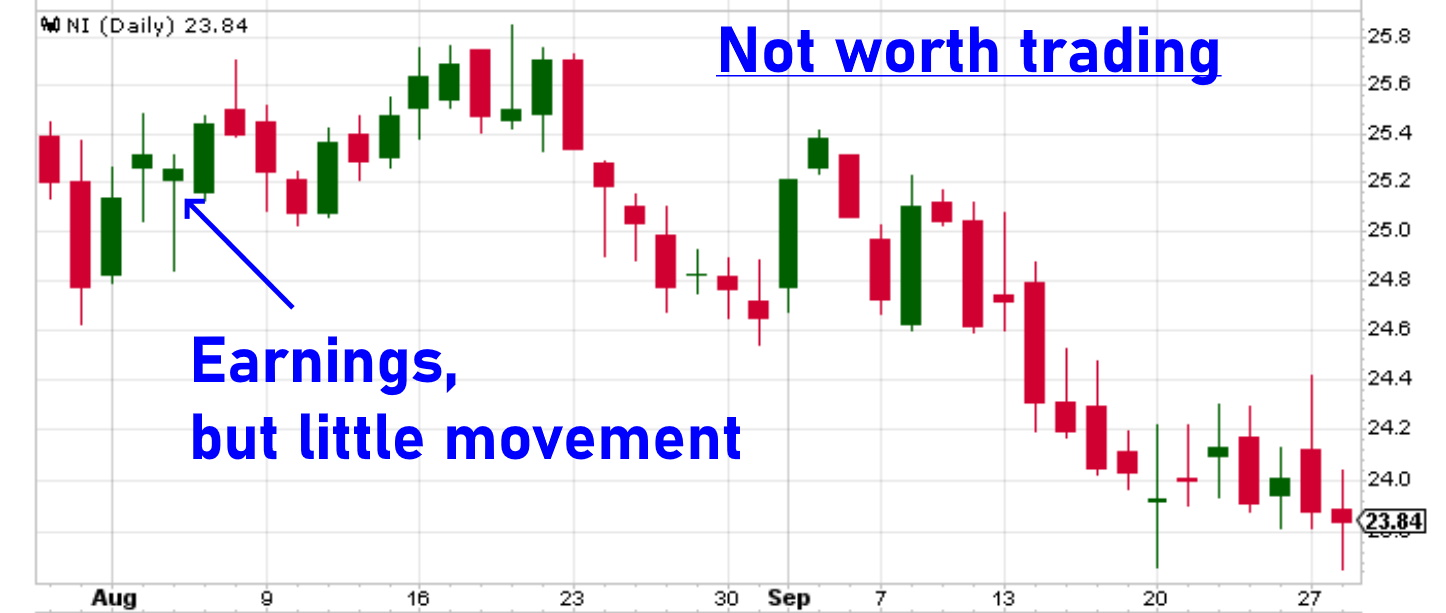
First, only trade stocks that are volatile over earnings reports. Stocks that barely move over earnings reports just don’t offer enough profit potential. Look at the past movements over earnings in the stock first so as to filter out those worth playing.
Second, look for quarterly patterns. Some stocks might look to be random over earnings when you consolidate all earnings movements. However, sometimes when you look at the stock quarter-by-quarter, such as looking only at Q1 earnings reports, you’ll find consistent movements in a certain direction.
Third, look at the risk/reward in the direction you intend to take. For profitable companies, EBITDA-to-EV is a good guide: Anything above 0.08 tends to be a good long opportunity, and anything below 0.06 tends to be a good short opportunity. For unprofitable companies, such as tech companies in their growth stages, you want to look at and make predictions for the key metric that has driven earnings-related movements in the past, often subscriber growth or monthly active users.
Fourth, look at the recent earnings reactions of other stocks in your targeted stock’s industry. You generally want to bet in the opposite direction. For example, if you are looking to play eBay and you found other internet retail stocks have sold off at earnings this quarter, this supports a long position on eBay over its earnings.
Be aware that earnings trades almost always coincide with gaps. So, get good at gap trading if you want to close the trade with some extra profits.
For more on earnings trading, check out my Exposing Earnings chat room.
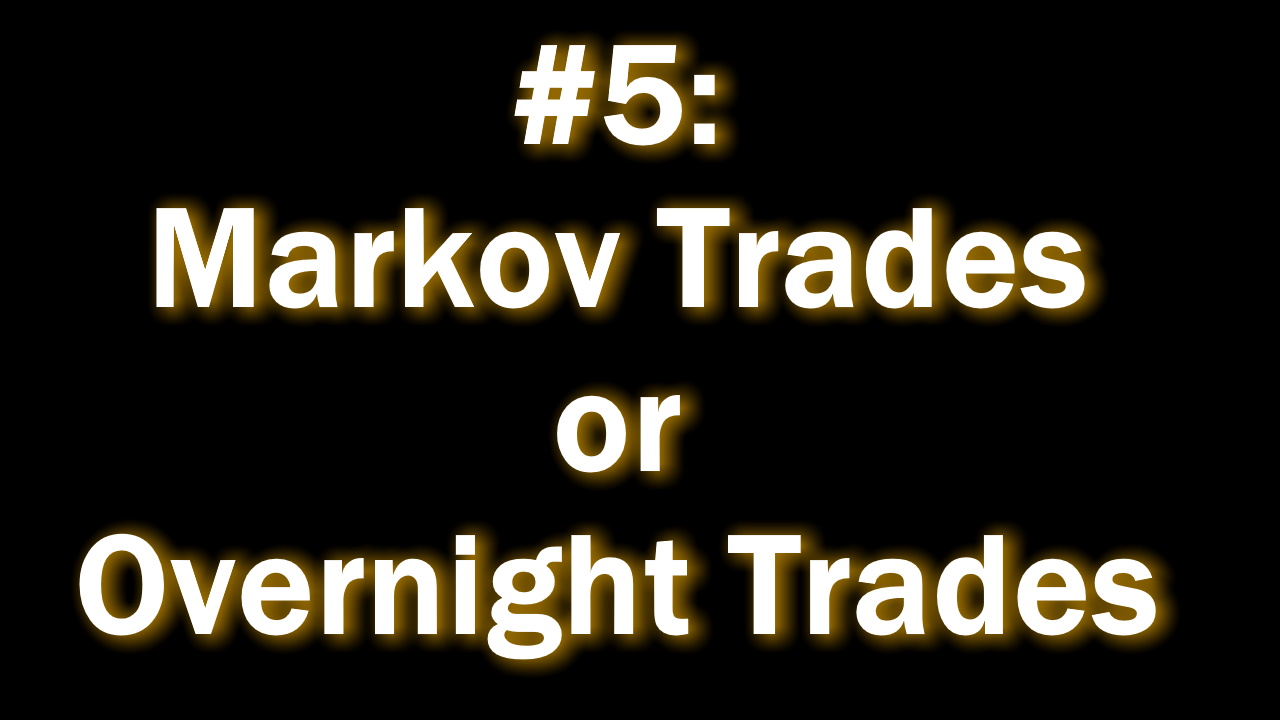
Number 5: Markov or Overnight Trading
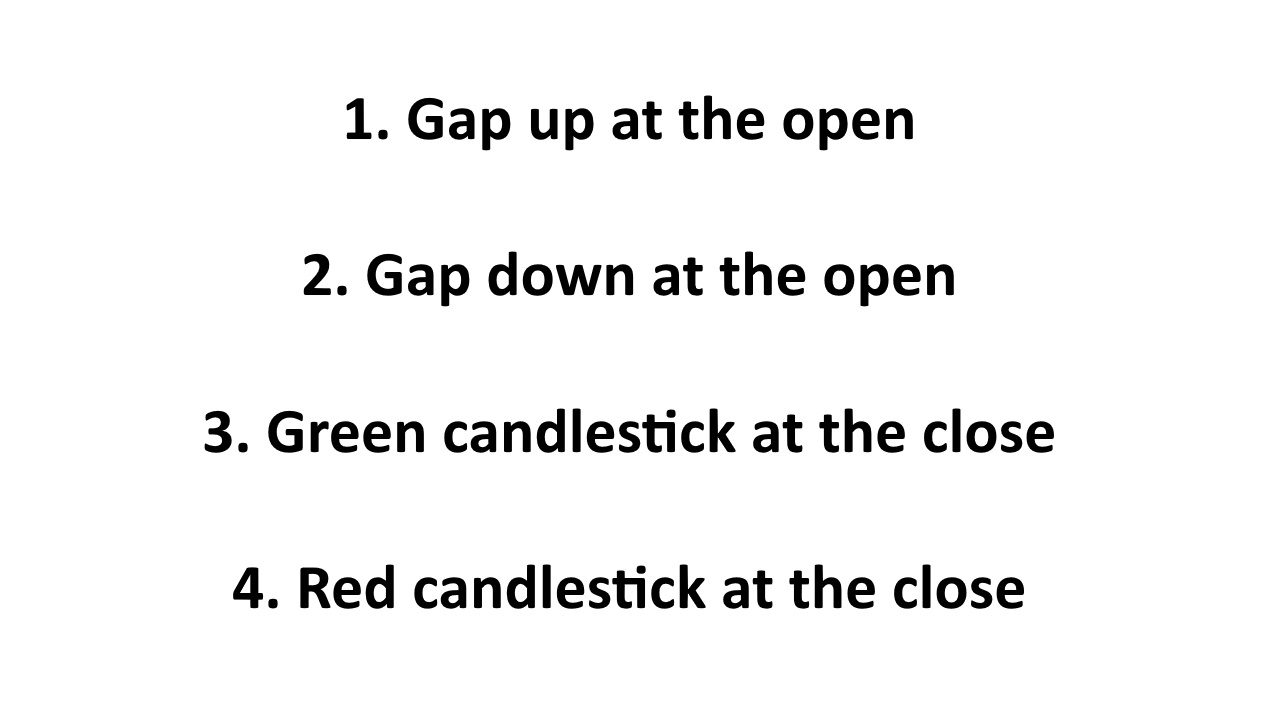
You won’t find the term “Markov trading” anywhere online, as it’s a term I coined myself. The phrase refers to Markov chains, a type of probability model that analyses states. For my applications, those states are the possible statuses of a stock at market open and at market close.
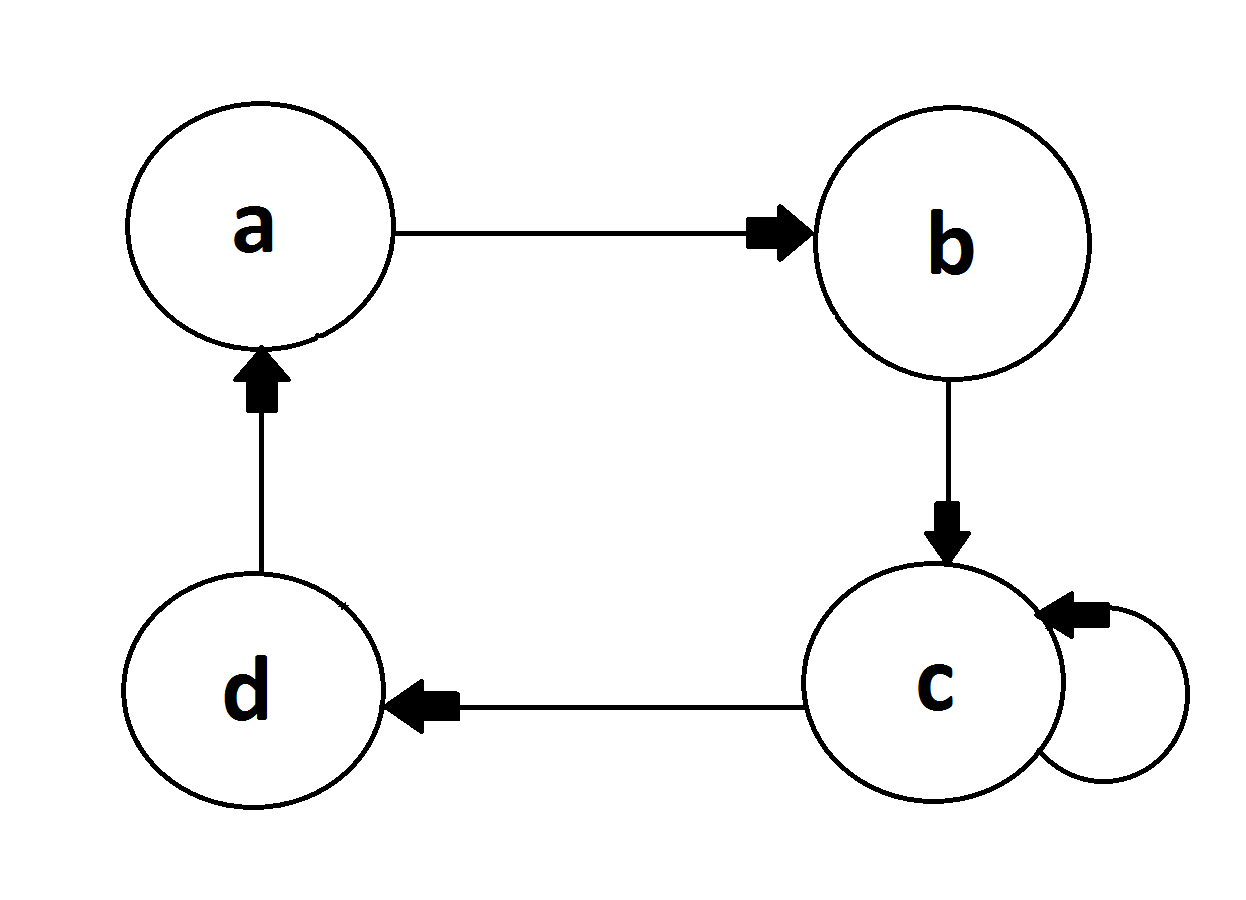
The states follow:
- Gap up at the open
- Gap down at the open
- Green candlestick at the close
- Red candlestick at the close
Markov trading, in essence, is playing the probabilities between these states. In the volatile markets of today, the movements between states can be big. With a few options contracts, we can make a few hundred or thousand dollars per trade as the targeted stock makes its movement from one state to another.
Note that trading between these states mean we will hold a stock either during the day or overnight. I prefer overnight holdings because the movements tend to be as large as daily movements but without forcing us into the theta decay that comes with holding options during the trading day. I sometimes call this “overnight trading,” where I am taking a position at the close and selling it at the open, essentially playing the overnight gap.
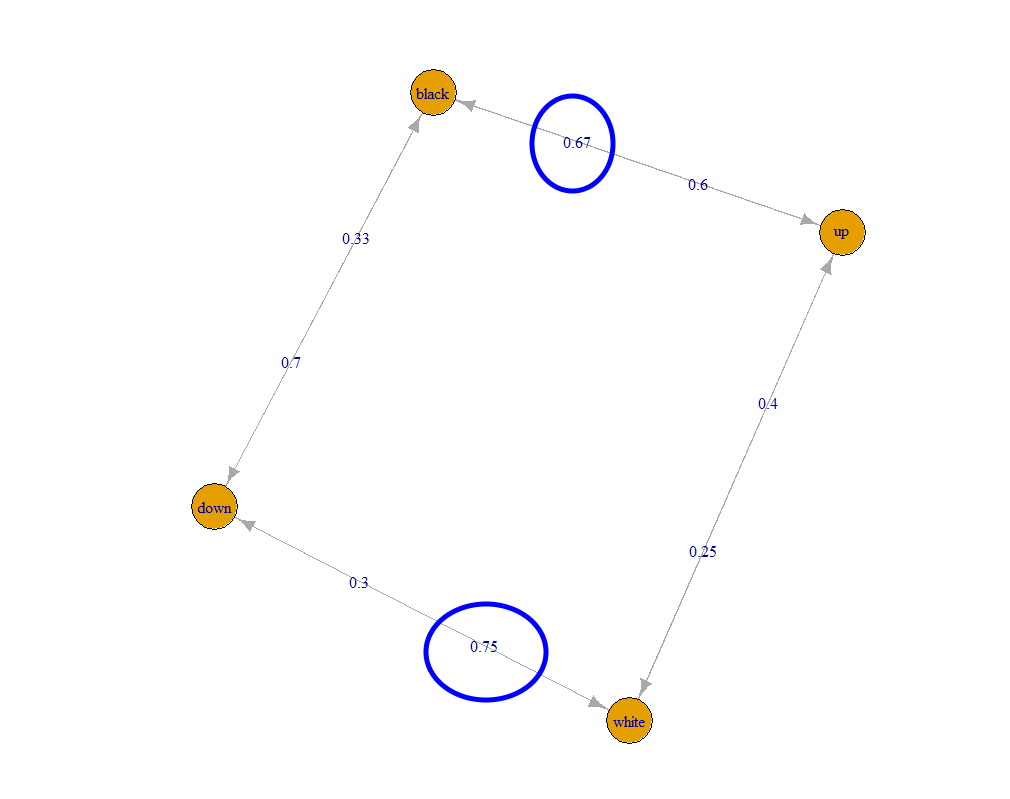
Because the probability transitions gradually change over time, I don’t have any heuristics to offer here. I run backtests all the time to find good overnight holding opportunities. For example, at the time of this video’s creation, the overnight trading pattern I found in the SPY is to buy puts at the end of the day if we see a green candlestick and buy calls at the end of the day if we see a red candlestick. The former gives a 75% win rate, with an average profit of $147 per option, and the latter gives a 67% win rate, with an average profit of $174. In addition, you can buy SPY options even after 4:30pm, so you can open a position after confirming the candlestick.
I send out Markov and overnight trades in my newsletter, which you can find in the here.
Conclusion
And that concludes my list of the top five trading strategies for 2022. Let me just leave you with a couple thoughts.
When I first started trading, it was really tough to build a reliable system because I hadn’t spent enough time testing all the potential trading strategies. I spent years building my toolbox and figuring out which trading strategies were optimal before settling down with a handful of working tactics. Of course, many new traders like to take shortcuts.

Some shortcuts, such as subscribing to black box trading signals, have severe drawbacks, such as not knowing the assumptions of said black boxes, which can break down under certain market conditions. Other shortcuts, such as having a trading mentor, offer almost only advantages with no disadvantages; such shortcuts can literally let you skip a lot of the process involved in testing strategies. Whether you take a shortcut, be sure that you understand the strategies that you’re employing in your trades.
No Comment