The Basics of Trading a Post-earnings Gap
Contents
The Steps of Trading A Post-earnings gap
Because a post-earnings gap occurs after a company releases an earnings report, many traders think that trading post-earnings gaps is different from trading any average gap. In many ways, this is true, as the catalyst for the gap is clear. While my post-gap analysis is quite complex and includes analyses that are often impossible for the average trader, to the best of my abilities, I will give you a simplified version of my step-by-step method for analyzing a post-earnings gap.
Here’s a high-level look at how to trade a post-earnings gap:
- Check the history of the stock’s post-earnings gaps.
- Understand the cognitive dissonance profile present in the stock.
- See whether EPS is a driver of the stock price.
- Look at the earnings call transcript for sentiment.
- Note any other technical signals that you feel are useful.
- Backtest the gap, if possible, and use candlestick patterns if not.
Most of my analyses are performed via coding. I know that not all traders have coding experience, but I will still post my ideas with the intent of showing you what is important in my analysis. Often, you can still get good rough estimates without needing coding or professional backtests.
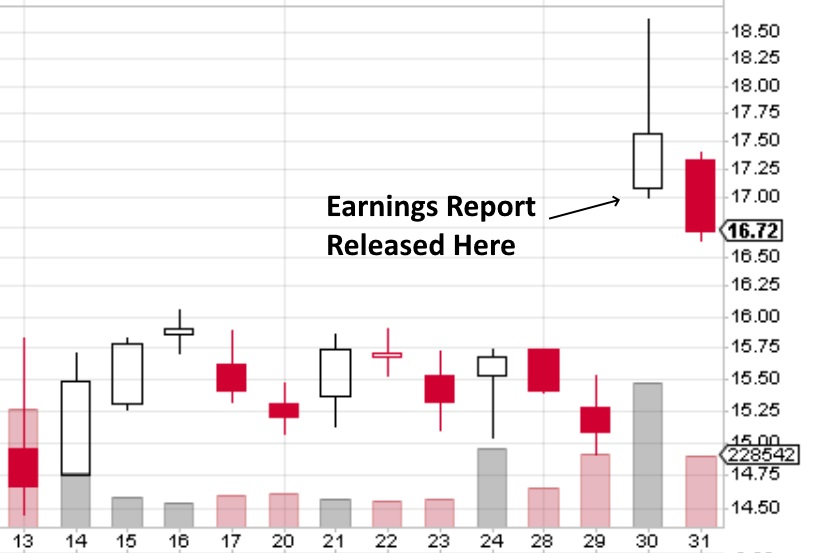
Check the Post-Earnings Gap History
Note the direction of the gap and look for similar gaps in the company’s history, after earnings dates. You should be looking to calculate a probability that describes whether the gap will close or widen. This can be done via code, manually, or eyeballing it.
Via code, just read in the past earnings dates, check the movement of the stock one day before versus one day after the earnings report, and then check the movement after the earnings report. This final check can be done time-based, as in checking the movement the week or month (whatever your time frame is) after the earnings report. Or it can be done price-based, as in checking if the gap fills.
Manually, you can grab a list of all the past earnings dates and check how the stock responded via a charting tool, such as Stock Charts.
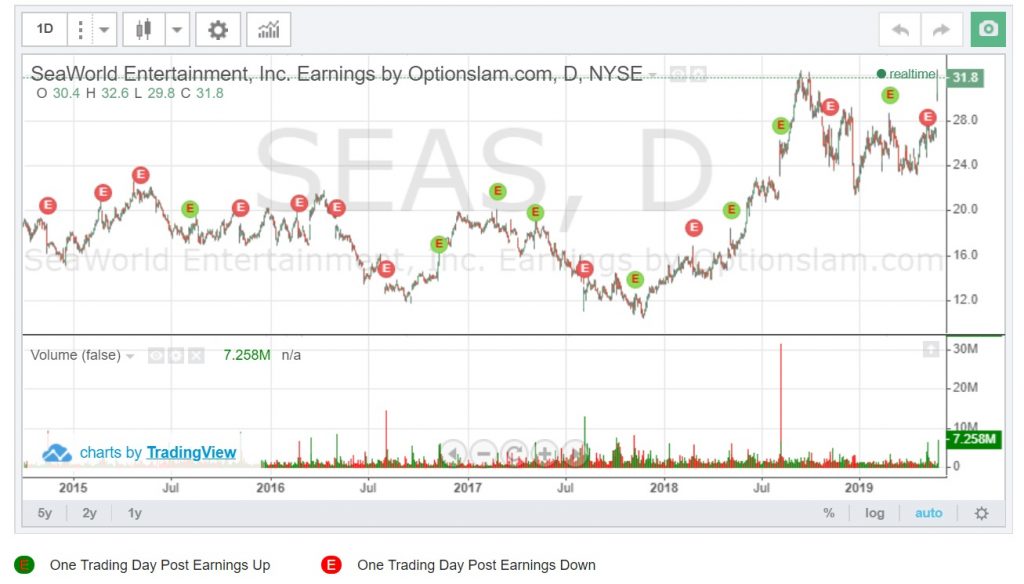
Eyeballing it can also be done and is the fastest way. I often do this before I run my code, just to get a general idea. The site I usually use for this is Optionslam, as everything is laid out pretty obviously in their charts. Here is an example:
Understand the Cognitive Dissonance Profile of the Stock
This one sounds a bit confusing, but the concept is actually simple: Each stock has its own set of investors, and those investors have their own “cognitive dissonance profile.” This describes an investor’s propensity to act in line with the concept of cognitive dissonance, such as in ignoring bad news in sinking stocks but overreacting by impulsively buying on good news.
An example will help here. Microsoft’s stock currently has a bullish cognitive dissonance profile. When the company posts good news (which includes positive earnings), its investors are more likely to add to their positions than are average investors. However, Microsoft investors are no less likely to sell their holdings when the company posts negative earnings surprises than are average investors.
Other stocks’ profiles might show profit-taking on positive earnings, creating up gaps that fill quickly. Or you might see a stock that is bolstered against bad news, creating small down gaps that quickly fill. In Microsoft’s case – according to this cognitive dissonance analysis – the best post-earnings gaps to play are breakaway gaps after positive earnings.
Knowing how the set of investors holding a stock is likely to act on different types of news can be helpful in determining the direction of a post-earnings gap.
Determine Whether EPS Changes Drive Stock Price
In many stocks, we see EPS changes brought about by earnings reports having no significant predictive ability for the stock in the coming months. However, some stocks can be predicted by EPS changes. We want to check the correlation between stock price and EPS, and, if we do find a correlation, we want to give weight to the EPS change in the most recent earnings report.
Going back to Microsoft, this is a stock of the latter type. The current correlation between EPS and stock price is 54%. If you plot the stock and EPS on the same chart, you can see how movements in EPS drive movements in the stock:
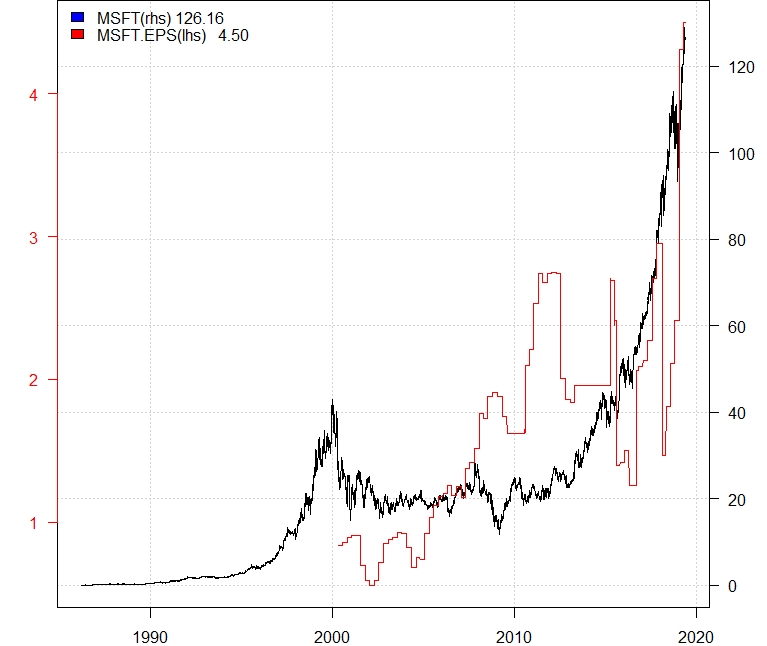
For stocks such as these, when we see EPS increasing, we want to add weight to the potential long trade. Likewise, consider shorting the gap when we see a real fall in EPS. For stocks that do not have an EPS/price correlation, we want to rely more on sentiment, which is step six in our analysis.
Analyze Management Sentiment
We will run this step for both stocks with EPS/price correlations and those without, but this is more powerful for the latter group. Management sentiment, as expressed in the earnings call, has predictive ability over the following quarter. It can also show us whether the post-earnings gap was an overreaction.
The sentiment analysis itself is difficult, as it requires financial lexical analysis. However, you can still get an idea of sentiment by reading the most recent earnings call transcript for the company. You can find these easily on Seeking Alpha. Here is the list of these transcripts for MOMO.
Note Any Useful Technical Signals
I am not too reliant on technical signals, but they do provide good second-opinions to an analysis that is almost complete. My courses point out the technical signals I do use, but the choice of technicals is still quite a personal choice. Regardless, some technical signals can be informative.
For example, I often use Stockta (the “ta” stands for technical analysis, making the URL easy to remember) to check the Fibonacci analysis (or “Fibs”). At Stockta, open a chart for your ticker-of-choice, and scroll to the bottom left to find the chart indicators:
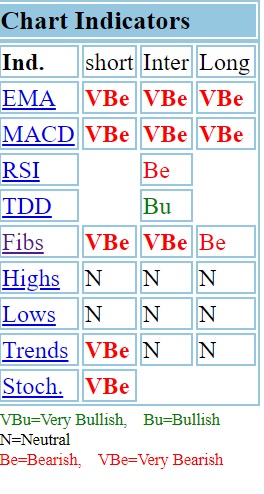
The Fibs here are “very bearish” in the short-term, which means that up gaps are likely to give way to reversals, filling more easily. Thus, we add weight to the idea that the gap will fill.
Backtest the gap, if possible, and use candlestick patterns if not.
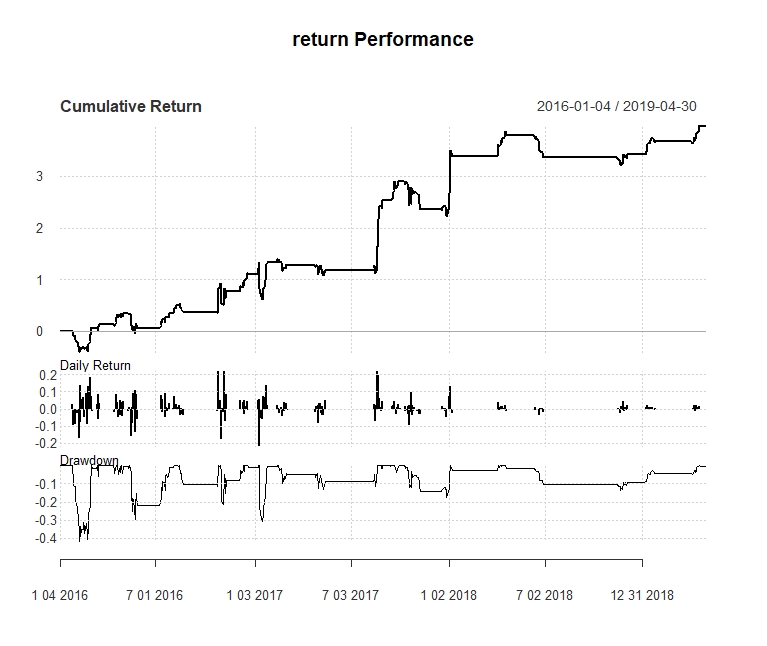
If you are able to backtest the gap, do so. My Gap Gameplan 2.0 strategy shows which direction should be your first backtest direction. For example, testing up gaps that appear between red-white candlesticks in Fiat Chrysler (FCAU), we find that the long direction tends to be the correct direction:
If you cannot test the gap with backtesting programs or your own code, just look at the candlesticks for the best direction. My Gap Gameplan 2.0 guide shows the best way to do this immediately after the gap, while the Gap Gameplan 1.0 shows how to do this after a more complex candlestick pattern, perhaps waiting a few days after the gap appears.
Conclusion
Post-earnings gaps are not that different from most gaps, but the fact that they occur after earnings reports means that the novel information introduced to the market is more abundant. Thus, we have more data to work with. Being so, we have a few more methods that can help us improve the accuracy of our gap plays.
In addition, post-earnings gaps tend to be larger than most gaps. Because of this, area gaps become more profitable. Most area gaps are quite small and occur on low volume, giving low profit margins. If we discover an area gap on an earnings report, however, we can get much better risk/reward ratios on our area gap plays.
Put simply, post-earning gaps are great gaps to play because of the increased amount of information we are able to use in our predictions and in the size of the gaps we are able to work with. The main downside with these gaps is the extra analyses we should employ to ensure high accuracies. Still, for any gap trader, the extra time involved should be worth it, as these gaps bring above-average ROIs.
No Comment