GNE: No Support in Sight
Contents
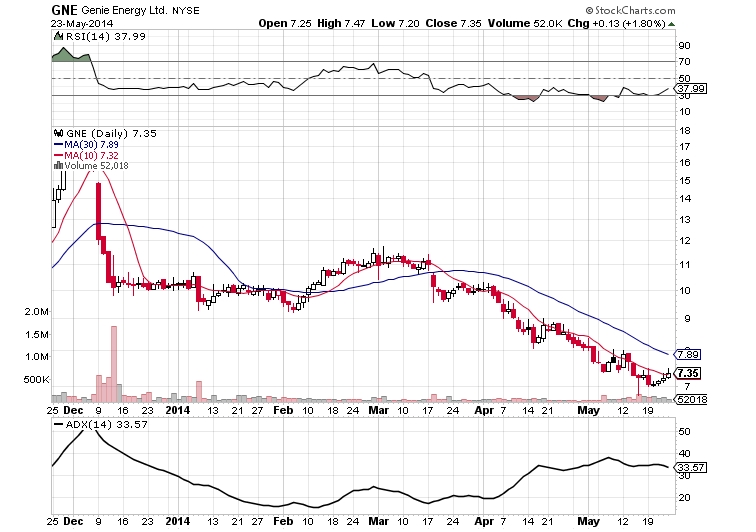
GNE is like a diving aircraft:

The Technical Analysis for GNE
GNE has been falling since March. No matter how many days you use to calculate the moving average, a strong downward trend holds. The average directional index, at 34, shows a strong momentum. The relative strength index has recently dipped upward after hanging around (and frequently dipping below) 30. This upward dip is a good indication that the stock is no longer appearing to be oversold, which means the downward trend is likely to continue from this point on.
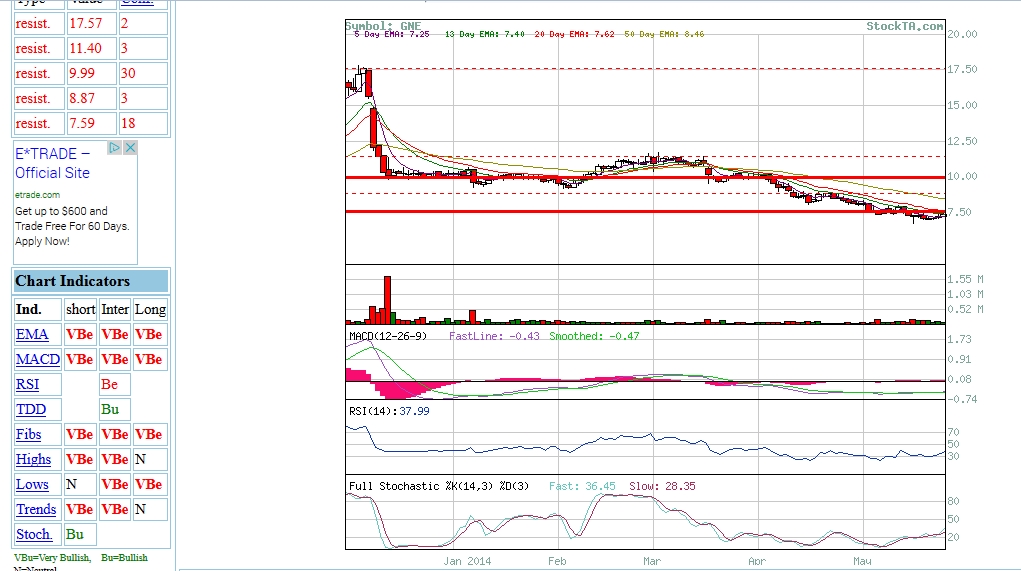
All signs point to bearish. Check out this chart:

Perhaps an even more important point here is that no support exists. In contrast, many strong resists exist, including one at 7.5, slightly above GNE’s current price of 7.35. After a recent week-long upward trend, GNE has again hit its resist and is likely to again shift downward.
My Prediction for GNE
GNE will act be herself. With no self-help books or spiritual awakenings, GNE will continue with its bearishness and bring put buyers and call sellers a decent amount of cash.
My Move | GNE At-the-Money Put
Because GNE is virtually at an all-time low, buying an out-of-the-money put might not be a good idea. Who knows how fast GNE will approach $5? Perhaps it will find support before it gets to that point. A better strategy is to buy an at-the-money or in-the-money put. To save some cash, I’ll be going with at-the-money puts for June.
Cost of buying 5 June21 puts at 7.5: ($225)
Net cost of the bought puts: ($225)
No Comment