TCB: What Pure Trend Analysis Says
Contents
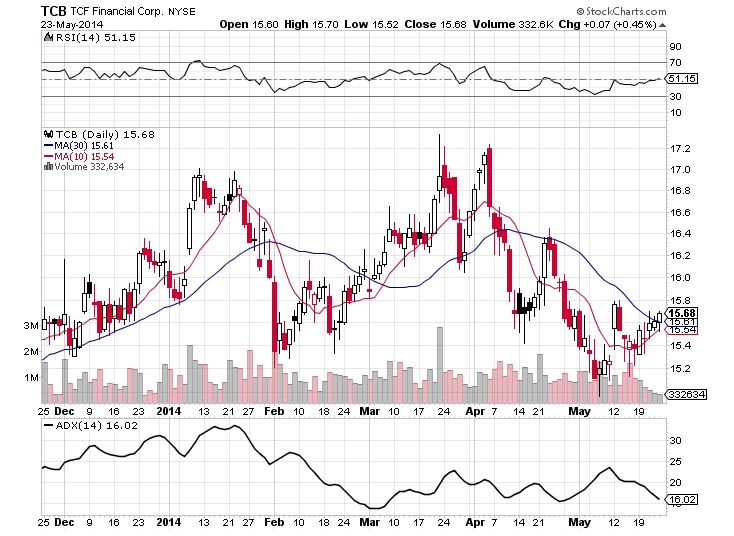
See if you can see a pattern in the candlestick chart of TCB. Pay attention to the 10-day and 30-day moving averages.
The Technical Analysis for TCB
TCB is rather uninteresting from the standpoint of technical analysis. It doesn’t have any gaps. Nor does it have any interesting candlesticks (those tiny haramis and engulfings you see at the beginning of last week mean nothing.
TCB’s ADX and RSI indicators are equally uninteresting. The relative strength index (RSI) being virtually at 50 essentially says that the stock is increasing on average as much as it decreases. But this is clearly not true for the short-term, simply by looking at all the peaks and valleys in the chart. The average directional index (ADX) is quite low, which means that no strong trend is in place. In fact, at low enough values (and I think TCB counts here), I believe that a poor ADX can symbolize a reversal in trend. If so, the stock is likely to start heading upward soon. As you’ll see in my prediction later, I believe this to be the case, but not because of the ADX.
Rather, I have noticed a pattern with the moving averages. When the moving averages intersect, it is likely to symbolize a new trend, in general. But you cannot use the impending intersection of two moving averages to predict a new trend, as it is just as possible that the moving averages will converge or simply touch once and “bounce” back. If you look at TCB, you see the blue and red lines, representing the 30-day and 10-day moving averages, respectively. After a 40-day separation, they are about to once again touch.
I believe that this time they will “cross over” one another and create a bullish trend. My reasoning for this simple: The past three times that the 10- and 30-day moving averages have closed in on one another, they passed one another instead of converging or bouncing back. This is either a trend with TCB in particular or an artifact of randomness. As a technical analyst, I must draw a line between trends and randomness, which is what I am doing here by claiming a coming bullish trend.
My Prediction for TCB
I’m not basing this bet on much more than the weak ADX and pattern in the moving average intersections for TCB. Statistically, perhaps I have a 60-70% chance of being right when I claim an upcoming bullish trend. But a stock’s history often tells much about its future, so it’s a chance I’m willing to put money on.
My Move | TCB Ratio Call
As I’m not super confident in my claim that TCB will shift to a bullish trend, I will play a ratio call. The benefit of this call is that I can play it at a premium, gaining profit from the bet even if I’m wrong. Here’s how I’ll play it:
Cost of buying 5 calls at 16: ($100)
Profit from selling 10 calls at 17: $150
Net profit of ratio call strategy: $50


No Comment