Let’s Play a Game: Fundamental Analysis vs. Technical Analysis: The Long Straddle
Contents
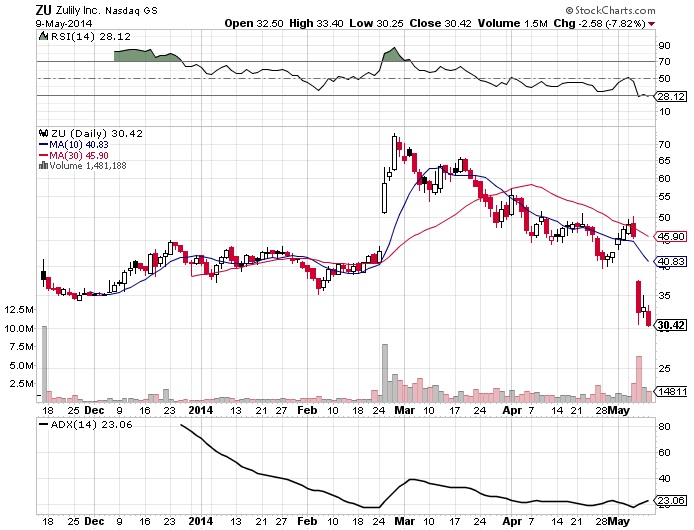
ZU is a stock that has risen quickly in the past two months and fallen just as quickly. A fundamental analyst would describe the sudden fall in price as a result of a poor earnings report issued two days ago. A pure technical analyst, on the other hand, would ignore such information and simply look at the chart itself:
The Technical Analysis for ZU
The first thing a technical analyst focused on playing options might notice in this chart should be the significant gap on May 7. This gap is nearly $10 large, representing a 20% drop in the stock price.
In technical analysis, this gap represents a short-term downward trend. Yet statistically, such a gap will later fill itself, reversing the direction of the trend to an upward, bullish trend. Fundamental analysts would probably eschew any claims that ZU will go back up, as the profitability of the company itself is in question. That is, a fundamental analyst, unlike a technical analyst who sees a gap as an indication of an upcoming bullish trend, would have no reason to believe that the downward trend will reverse.
But this is not a small gap. A gap as significant as 20% should, statistically, follow the rules of gaps: It will spur a short-term downward trend, followed by a mid-term upward trend.
But not only does the gap imply a coming bullish trend; the RSI does as well. With an RSI of 28, this stock is likely oversold. Hence, buyers should enter the market soon, causing a bullish trend.
My Prediction for ZU
Fundamental analysis says that a company that doesn’t meet its goals in profitability, thereby angering shareholders, will fall in value. Thus, fundamental analysis would predict a continued downward trend for ZU.
Technical analysis shows mixed signals:
- The overall trend and moving averages imply a continued downward trend.
- The gap down implies a continued downward trend.
- The gap down implies a coming bullish trend.
- The RSI implies a coming bullish trend.
Let’s play a game: We’ll bet on both directions. We’ll play the long straddle.
My Move | ZU Long Straddle
ZU is currently at 30.42 prior to the market opening. I predict significant movement on the opening day, though I don’t know which direction. I will buy two call contracts at the strike price of 30 (slightly in the money) and two put contracts at 30 (slightly out of the money). Should ZU move in either direction, one of my options should decrease in value while the other increases. At the price of this strategy as long as stock moves far enough to make one of the option contracts worth around $500, I will profit on this strategy. The key is speed of movement, not direction.
Cost to buy 2 calls at 30: ($490)
Cost to buy 2 puts at 30: ($400)
Net cost of long straddle: ($890)

No Comment