AMSWA: Signs Point to a Downward Trend
Contents
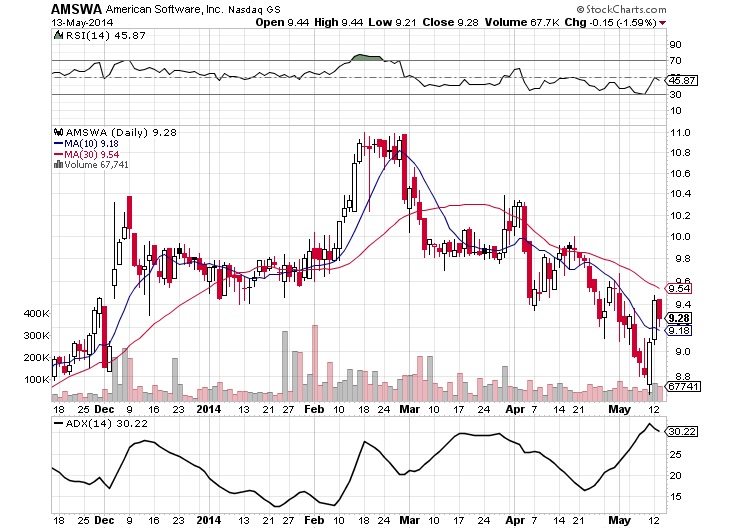
AMSWA is rather volatile, considering its limited range. Though consistently trading between 8 and 11 in the last six months, AMSWA has had its ups and downs:
The Technical Analysis for AMSWA
A pretty strong case can be made for a continued downward trend of AMSWA. First of all, since the middle of February, AMSWA has been trending downward, both gradually and with significant drops. In the past two months, this trend has brought the stock down by around $2, nearly 20% its total value.
The ADX of the stock is slightly over 30, implying a rather strong momentum for this downward trend. The RSI is in normal range. The shape of candlestick chart might lead an investor to believe that AMSWA is overbought, but RSI seems to say that it’s not. Thus, the recent short-term upward trend might continue. But this does not seem likely at the moment (see the next section).
One important feature of this candlestick chart is the inverted hammer on May 13 (the chart doesn’t show this, but it’s there). Inverted hammers after a short-term upward trend tend to imply a reversal of that upward trend. At the same time, inverted hammers in a medium-to-long term bearish trend tend to solidify the trend, telling investors that the bearish trend is virtually confirmed to continue. The inverted hammer here for AMSWA can be interpreted in both ways, implying a coming bearish trend in either case.
It is important to note that no strong resists or supports exist around where the stock is currently trading ($9.28). Thus, an upward or downward trend is likely to break new ground. I hope this is true with a downward trend, as I intend to buy a put.
My Prediction for AMSWA
Everything in the technical analysis implies a downward trend. Though AMSWA has been trending up for the last three days, nothing in the technical analysis supports the continuation of this bullish trend. I am assuming it’s a simple burp in the market and will be taking advantage of the stock’s relative high to buy a put option at a reduced price.
My prediction is that AMSWA will continue its bearish trend for at least one more week.
My Move | AMSWA In-the-Money Put
With its current high, AMSWA offers put options at a reduced price. I will buy a one-month put option at the strike price of $10. Should AMSWA continue its bearish trend, my put option will quickly increase in value (because it is already in-the-money).
Cost to buy 2 puts at 10: ($190)
Net cost of put strategy: ($190)

No Comment