GWW: Climbing a Greasy Ladder
Contents
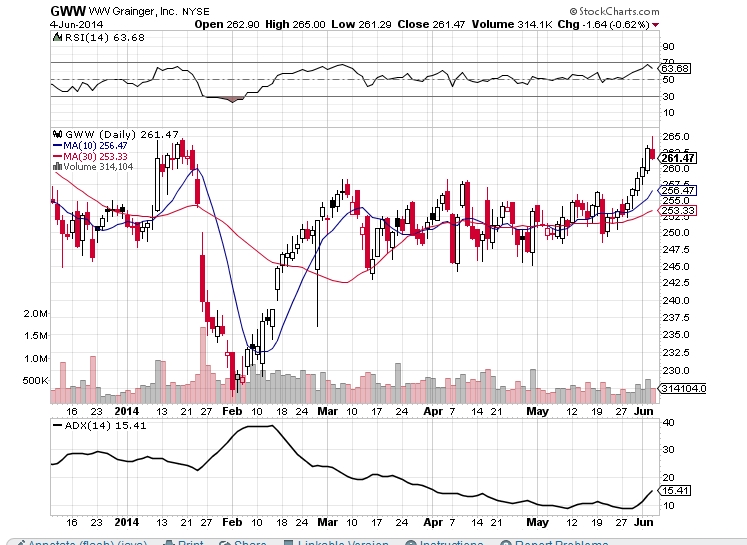
GWW has been stable for three months. But that changed last week:
The Technical Analysis for GWW
Though the 10-day moving average passed the 30-day moving average at the beginning of May, the average directional index (ADX) for this stock is still quite weak. This implies a lack of evidence that the recent upward trend GWW saw during the past week is likely to hold. Thus, though many might see GWW’s recent upward movement and think “bearish,” no clear evidence shows this to be true.
In contrast, on June 4 GWW displayed a bearish harami. Though bearish haramis are usually not useful in candlestick analysis, sometimes they can be. When a bearish harami appears at the top of an upward trend, it often indicates a coming trend reversal.
Also notice an upward gap about five days ago. This gap has yet to be filled. One possibility is that this gap is insignificant and will not be filled. But another is that this short-term upward trend has simply not hit its reversal—yet.
Finally, notice that the red candle coincides with the RSI nearly hitting 70. It is possible that GWW is overbought.
My Prediction for GWW
Taking into account the history of GWW and its long-term stability, I believe GWW will return to stability. However, it will not be at 260, where it is now, but at a lower level, after this short-term upward trend reverses and then evens out.
My Move | GWW Bear Put Spread
GWW put options are rather expensive at the moment. GWW is unlikely to fall a huge amount and will likely only be falling back to a more reasonable level (say, around 255). For these reasons, a bear put spread is a suitable strategy. I will buy a put at 260 and sell another at 250. This will alleviate my cost to buy the 260 put, which I believe will soon be in-the-money.
Cost of buying 1 June put at 260: ($270)
Profit from selling 1 June puts at 250: $60
Net cost to open the bear put spread: ($210)

No Comment